Enhancing the SaaS & Driving Growth at FruitfulInc.
User-Centric Design | Usability Testing | Prototyping | Business Alignment | Problem Solving | Stakeholder Management
10 min read


User-Centric Design | Usability Testing | Prototyping | Business Alignment | Problem Solving | Stakeholder Management
10 min read
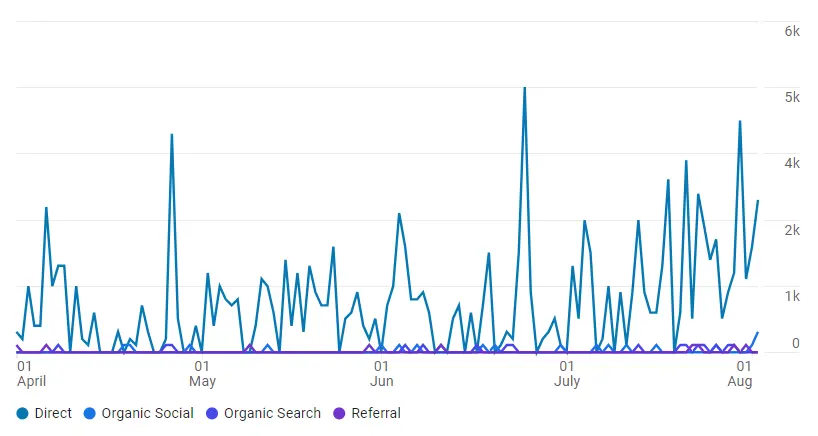
Growth in website traffic, increasing Fruitful's online presence
Increase in user retention rates by Analyzing user behavior, A.B testing
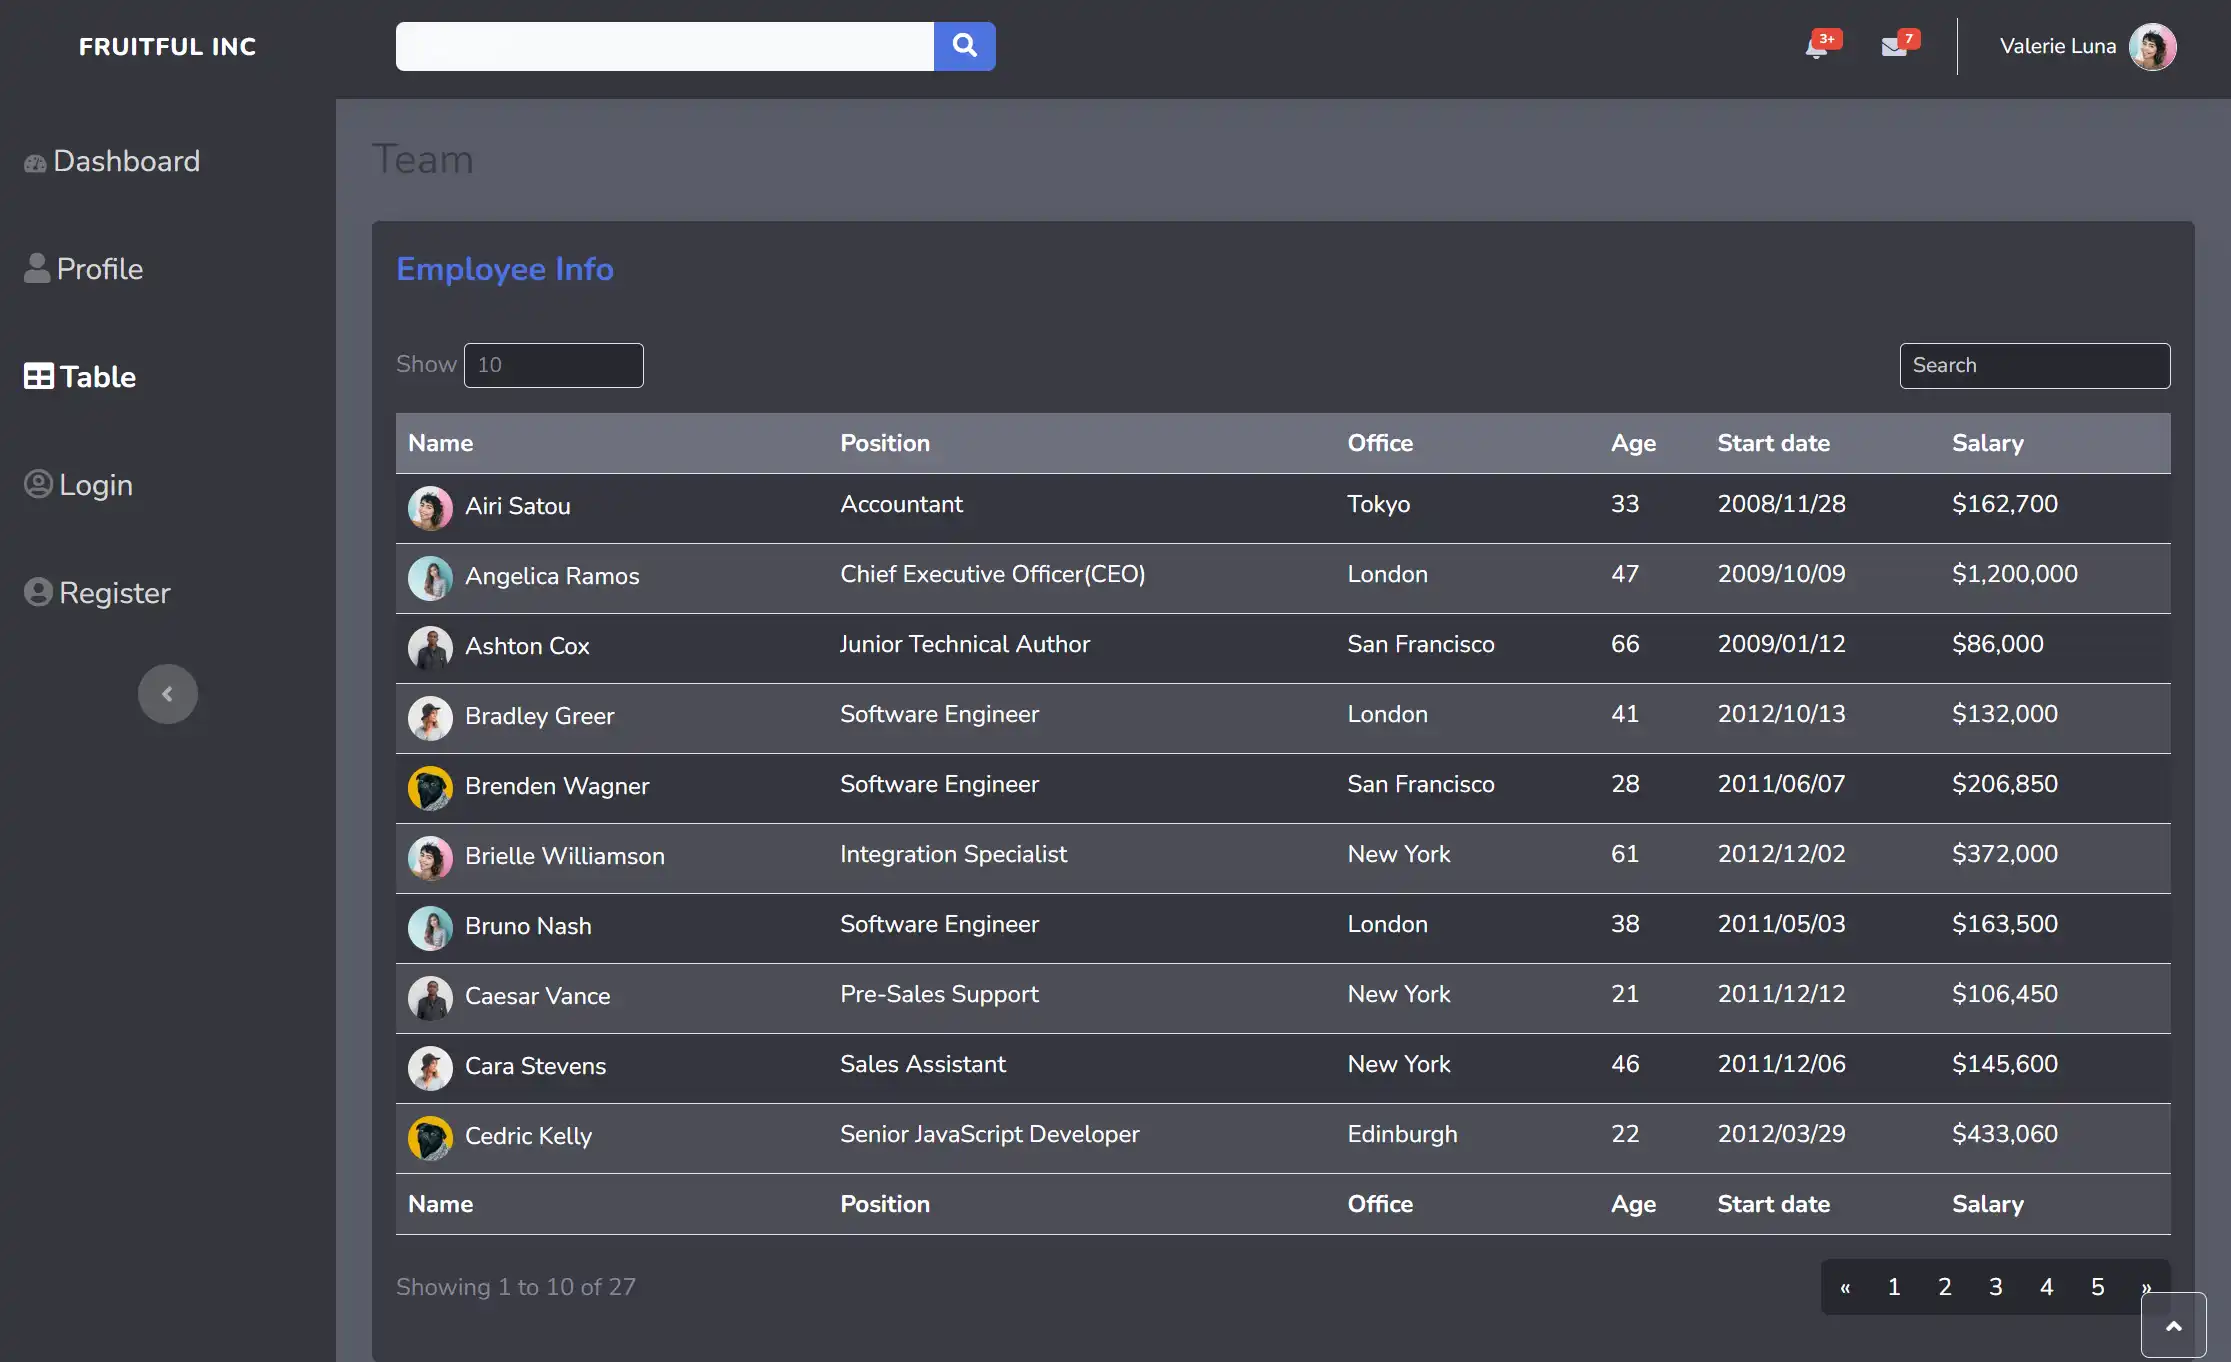
25% reduction in task completion time with Visually Enhanced Dashboard Redesign
As a UI/UX Designer at FruitfulInc, my mission was clear: to elevate the user experience and propel the company's growth. Through a range of strategic actions, I made a substantial impact:
Conducted in-depth analysis of user interactions to uncover actionable insights, driving data-informed design and development decisions that enhanced the overall user experience.
Leveraged A/B testing to evaluate design elements and features, enabling precise identification of user preferences and optimizing engagement through evidence-based improvements.
Partnered closely with the development team to refine workflows, accelerating the implementation of design updates and boosting operational efficiency across projects.
Organized frequent usability testing with real users to validate designs, ensuring solutions were not only visually appealing but also intuitive, accessible, and aligned with user needs.
Recognizing the need for a more agile and collaborative approach to product development, FruitfulInc aimed to streamline communication and foster efficient collaboration between UX designers and developers.
In tackling this challenge, I, as the UX designer, took the initiative to establish strong partnerships with the development team, emphasizing the adoption of Agile methodologies. The approach was tailored to create an environment conducive to iterative design processes, rapid feedback loops, and an overall more efficient product development pipeline.
Key steps in the approach:
Partnered with developers to foster communication through regular meetings, brainstorming sessions, and workshops, aligning design goals with technical needs.
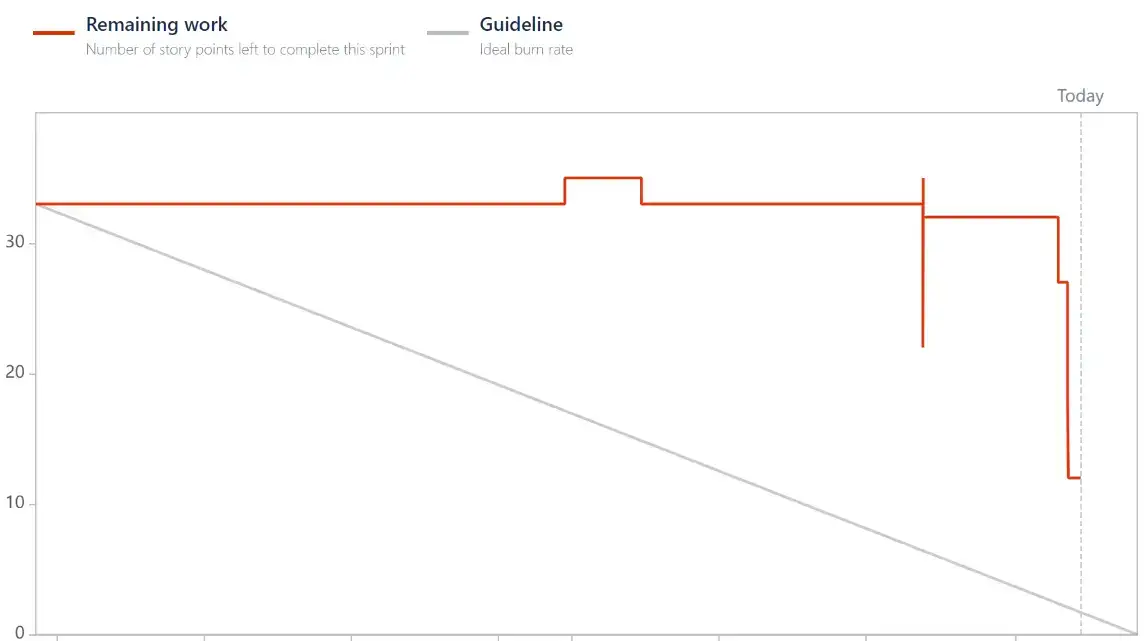
Agile Implementation: Introduced Scrum to improve workflows, enabling the team to adapt quickly to changing priorities.
Promoted iterative design with built-in feedback loops to validate concepts early and align with development goals.
Used interactive prototypes for rapid feedback from developers and stakeholders during early design stages.

The adoption of Agile methodologies under the UX designer's guidance yielded remarkable improvements:
Agile methodologies streamlined workflows, enabling swift adaptation to evolving project requirements and priorities, crucial for addressing dynamic business needs.
Enhanced collaboration between UX designers and developers fostered clear communication, shared ownership, and joint responsibility for the final product.
Agile's iterative approach enabled rapid adjustments based on continuous feedback, producing more user-centered designs.
Synchronization between design and development ensured seamless incorporation of changes, creating a cohesive product lifecycle.
Agile-driven collaboration and efficiency resulted in high-quality products delivered faster.
From the perspective of the UX designer, the successful implementation of Agile methodologies not only addressed the challenge of streamlining communication but also ushered in a new era of collaboration and efficiency. The focus on iterative design, rapid feedback, and cross-functional teamwork significantly contributed to the delivery of high-quality products, reinforcing the importance of a well-integrated UX design approach within an agile product development framework.

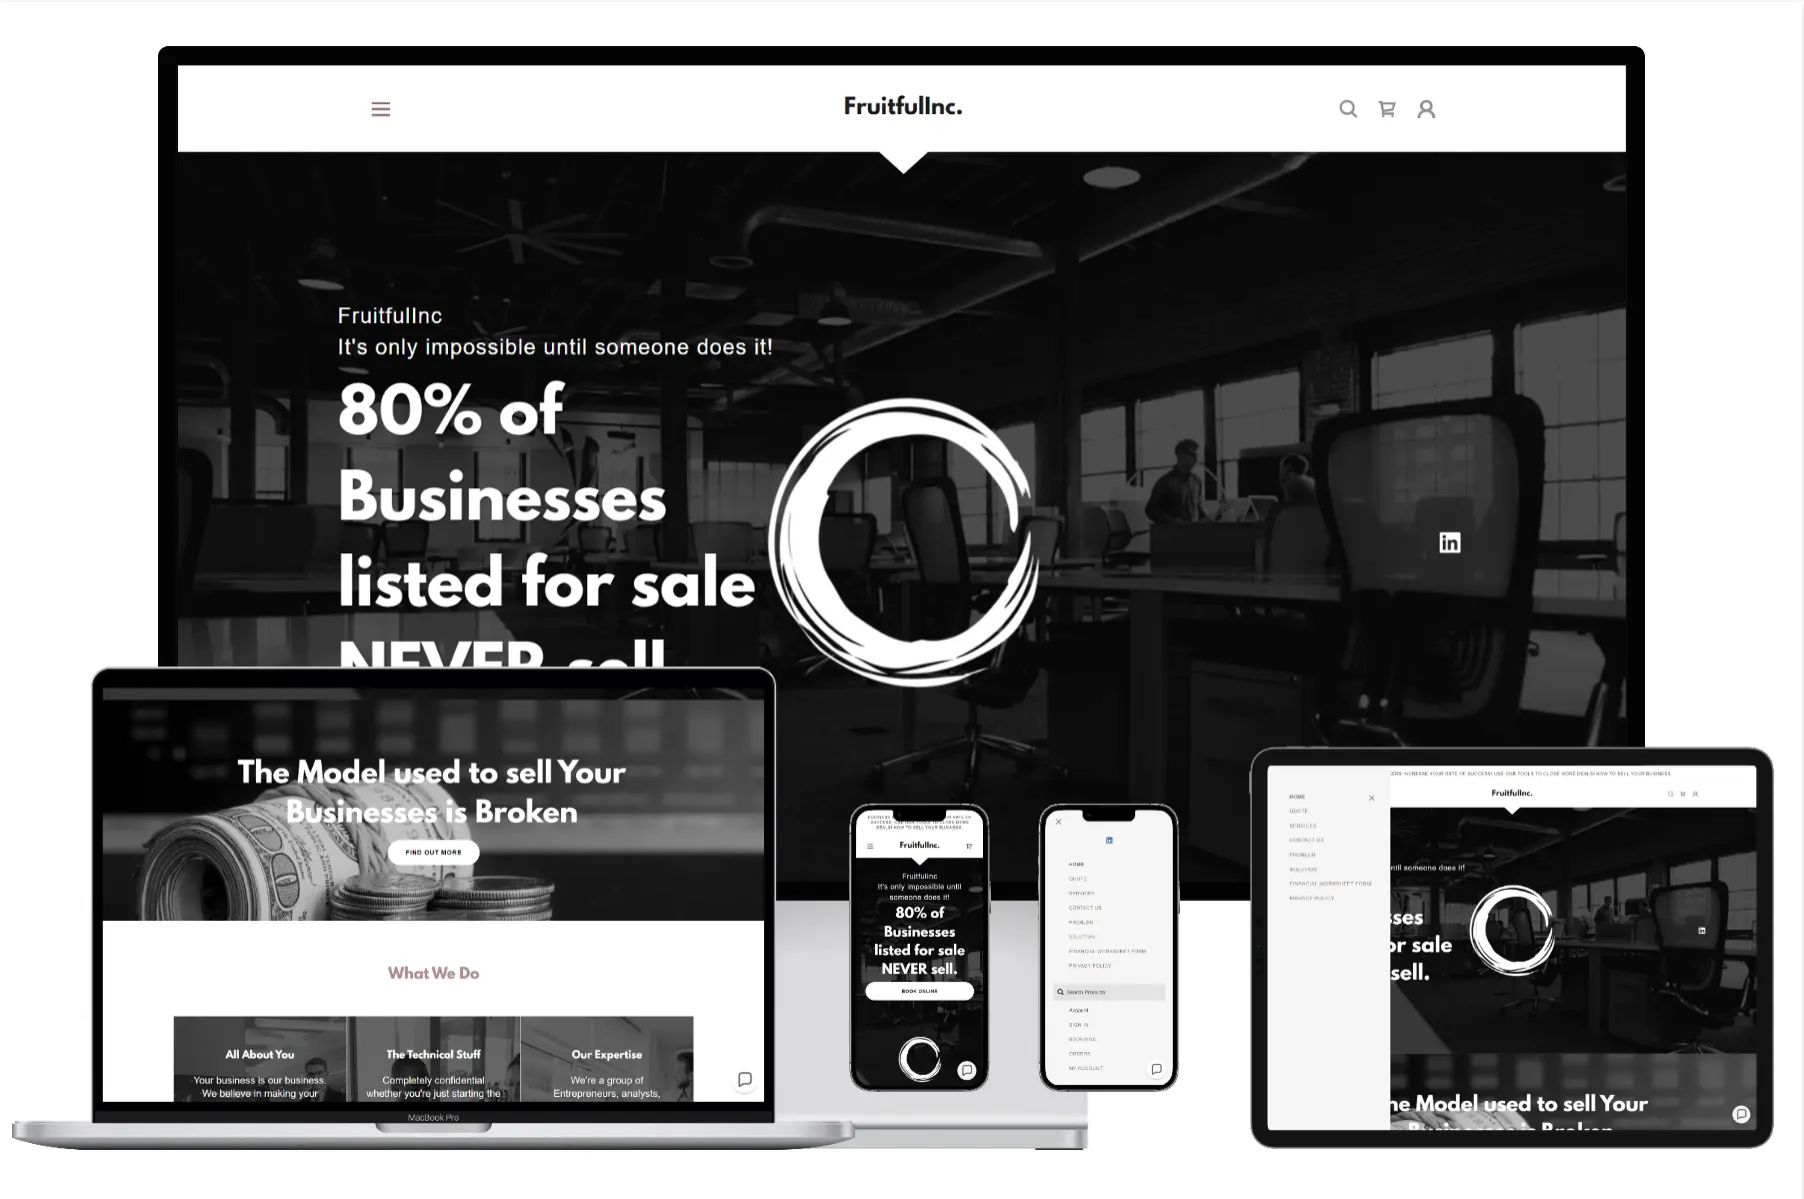
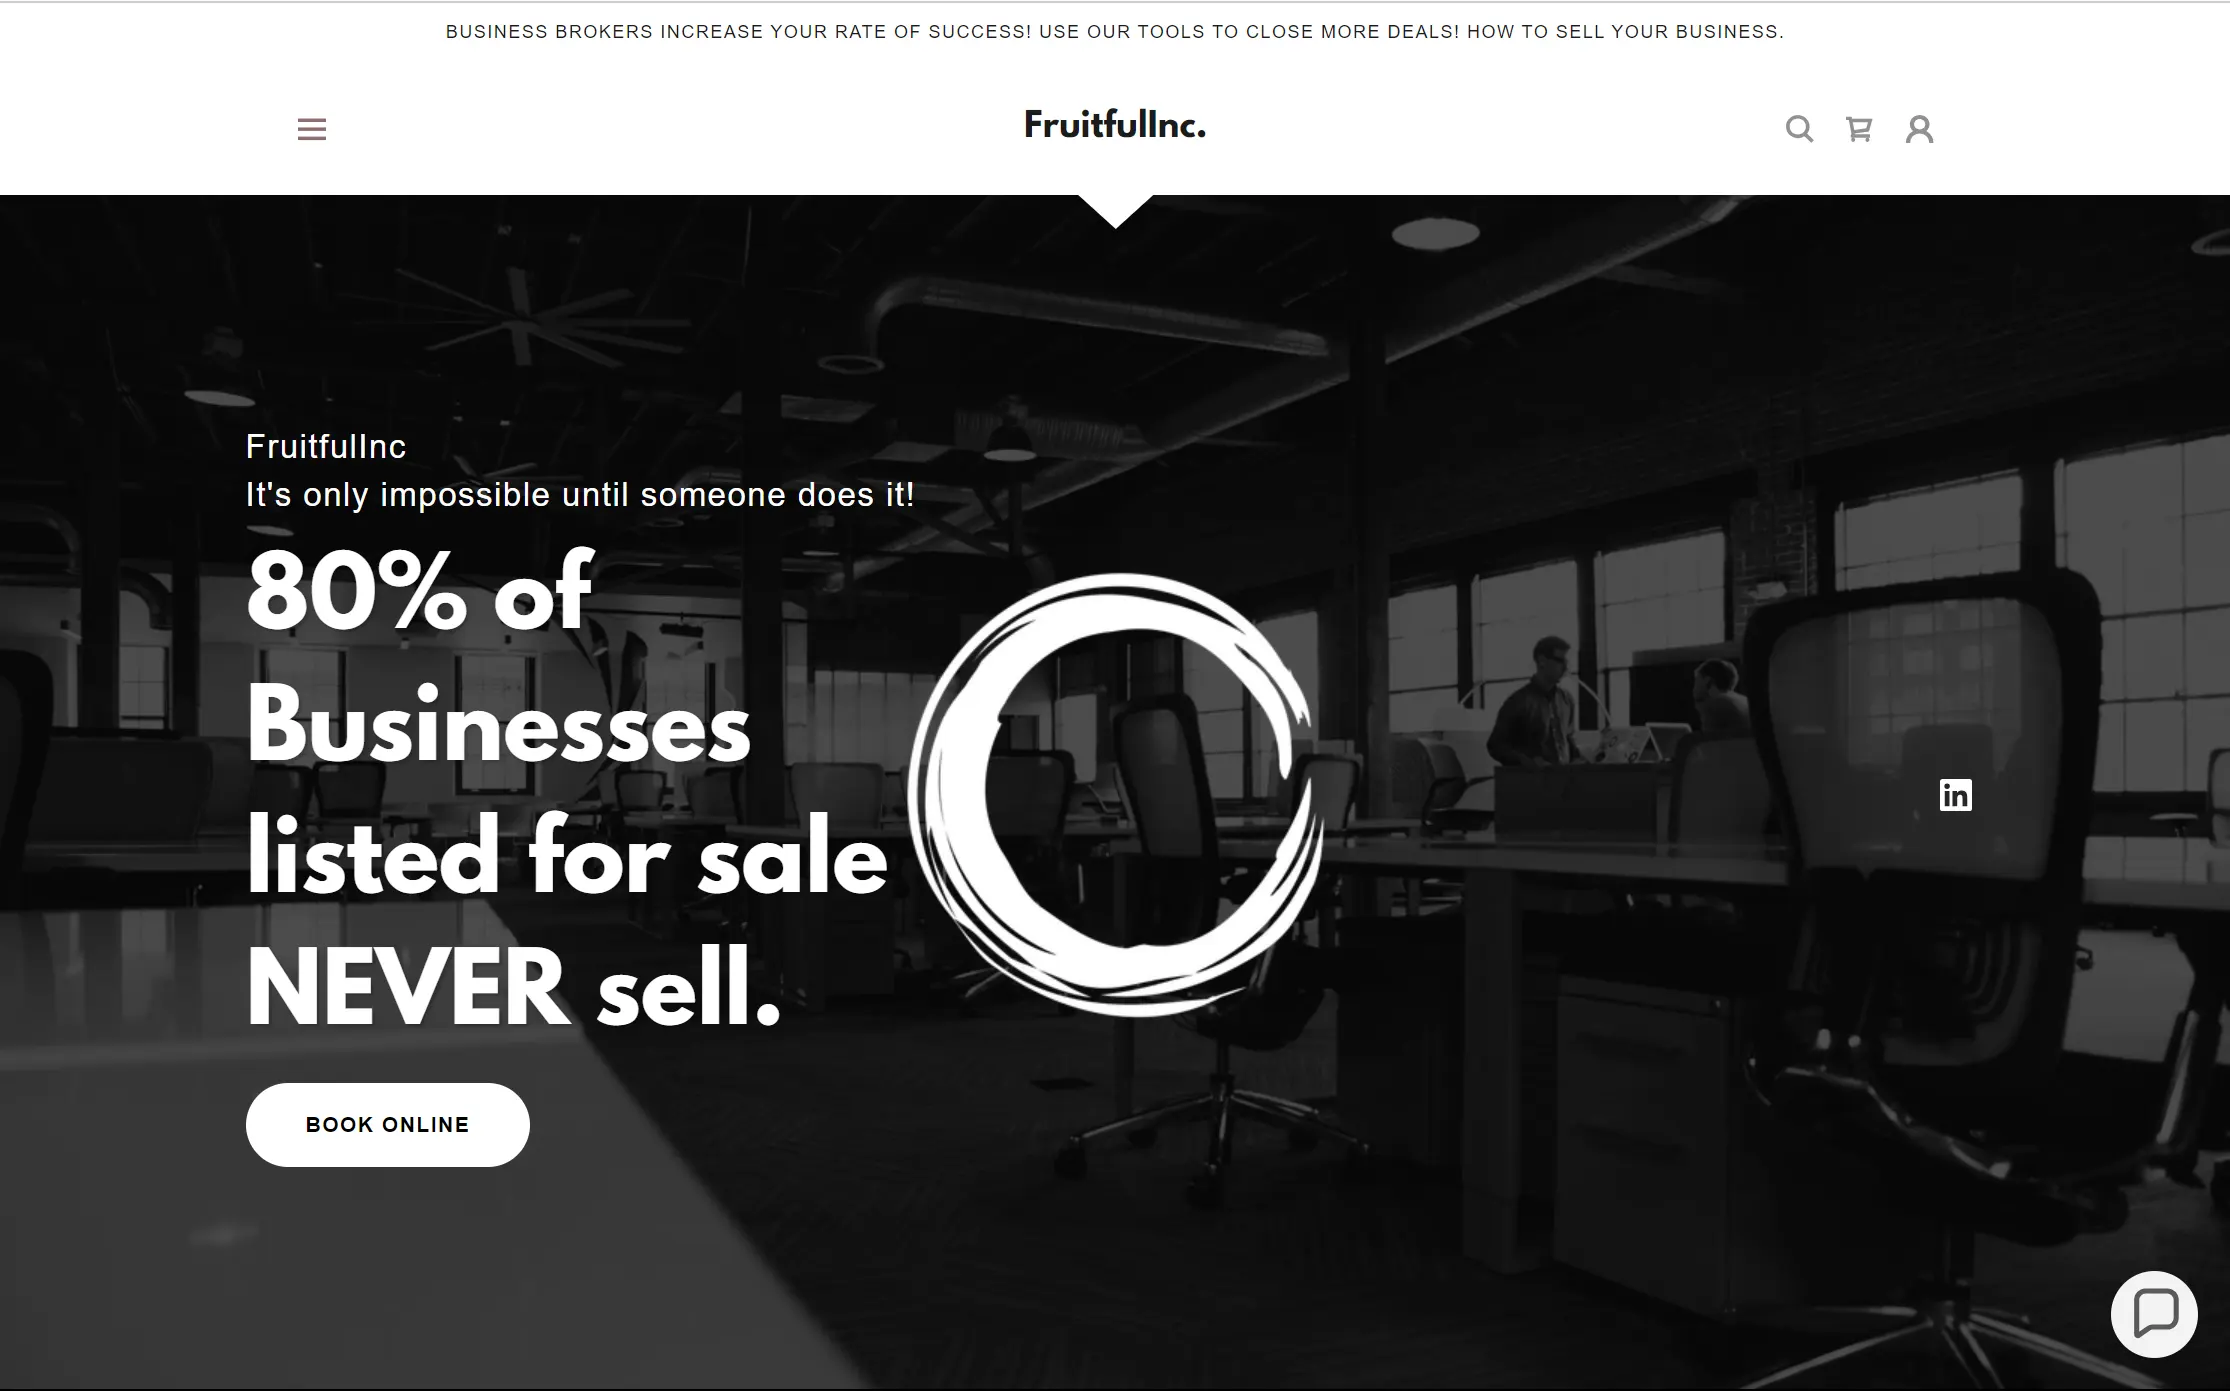
FruitfulInc had an attractive, user-friendly interface for their online business buying and selling platform. However, website traffic stalled around 4,000 monthly visitors, preventing company growth. Without a sufficient pipeline of potential buyers and sellers. My challenge was to diagnose issues stunting traffic growth and implement solutions to double traffic.
I started by conducting in-depth analytics across all website pages and user workflows. Key quantitative findings:
Landing page bounce rate was a concerning 60%, with most visitors leaving within 30 seconds without visiting other pages or features.
Of those who continued, only 25% reached the advanced search feature to search current business listings.
Average session duration remained low at 1.5 minutes, with minimal scrolling or clicks around listings.
Qualitative user interviews also suggested visitors expected more customization, pricing details, and seller qualification information upfront. The hypothesis emerging was a lack of perceived value proposition due to no visible monetization model on the marketing site pages. Visitors were unclear on pricing structures or transaction security, creating an untrustworthy vibe.
I proposed an aggressive A/B testing roadmap on 5 alternative revenue models:
Subscription tiers based on number of listings
Bidding model with credits for searches, contact requests other actions
Commission model published as a percentage on transactions
I built engaging models with explanatory interaction flows and pricing calculators. We optimized based on early data trends, moving commission model C to the pole position after its 53% conversion rate lift indicated highest potential.
The transparent upfront pricing and security assurances converted significantly more visitors into transacting partners. This case study highlighted my ability to diagnose key UX issues, identify alternative solutions, and drive rapid growth even when pressed for time. Optimizing the monetization model played a foundational role in bolstering Fruitful Inc's value proposition.
*Unfortunately Graphs and data visualizations are restricted due to NDA.

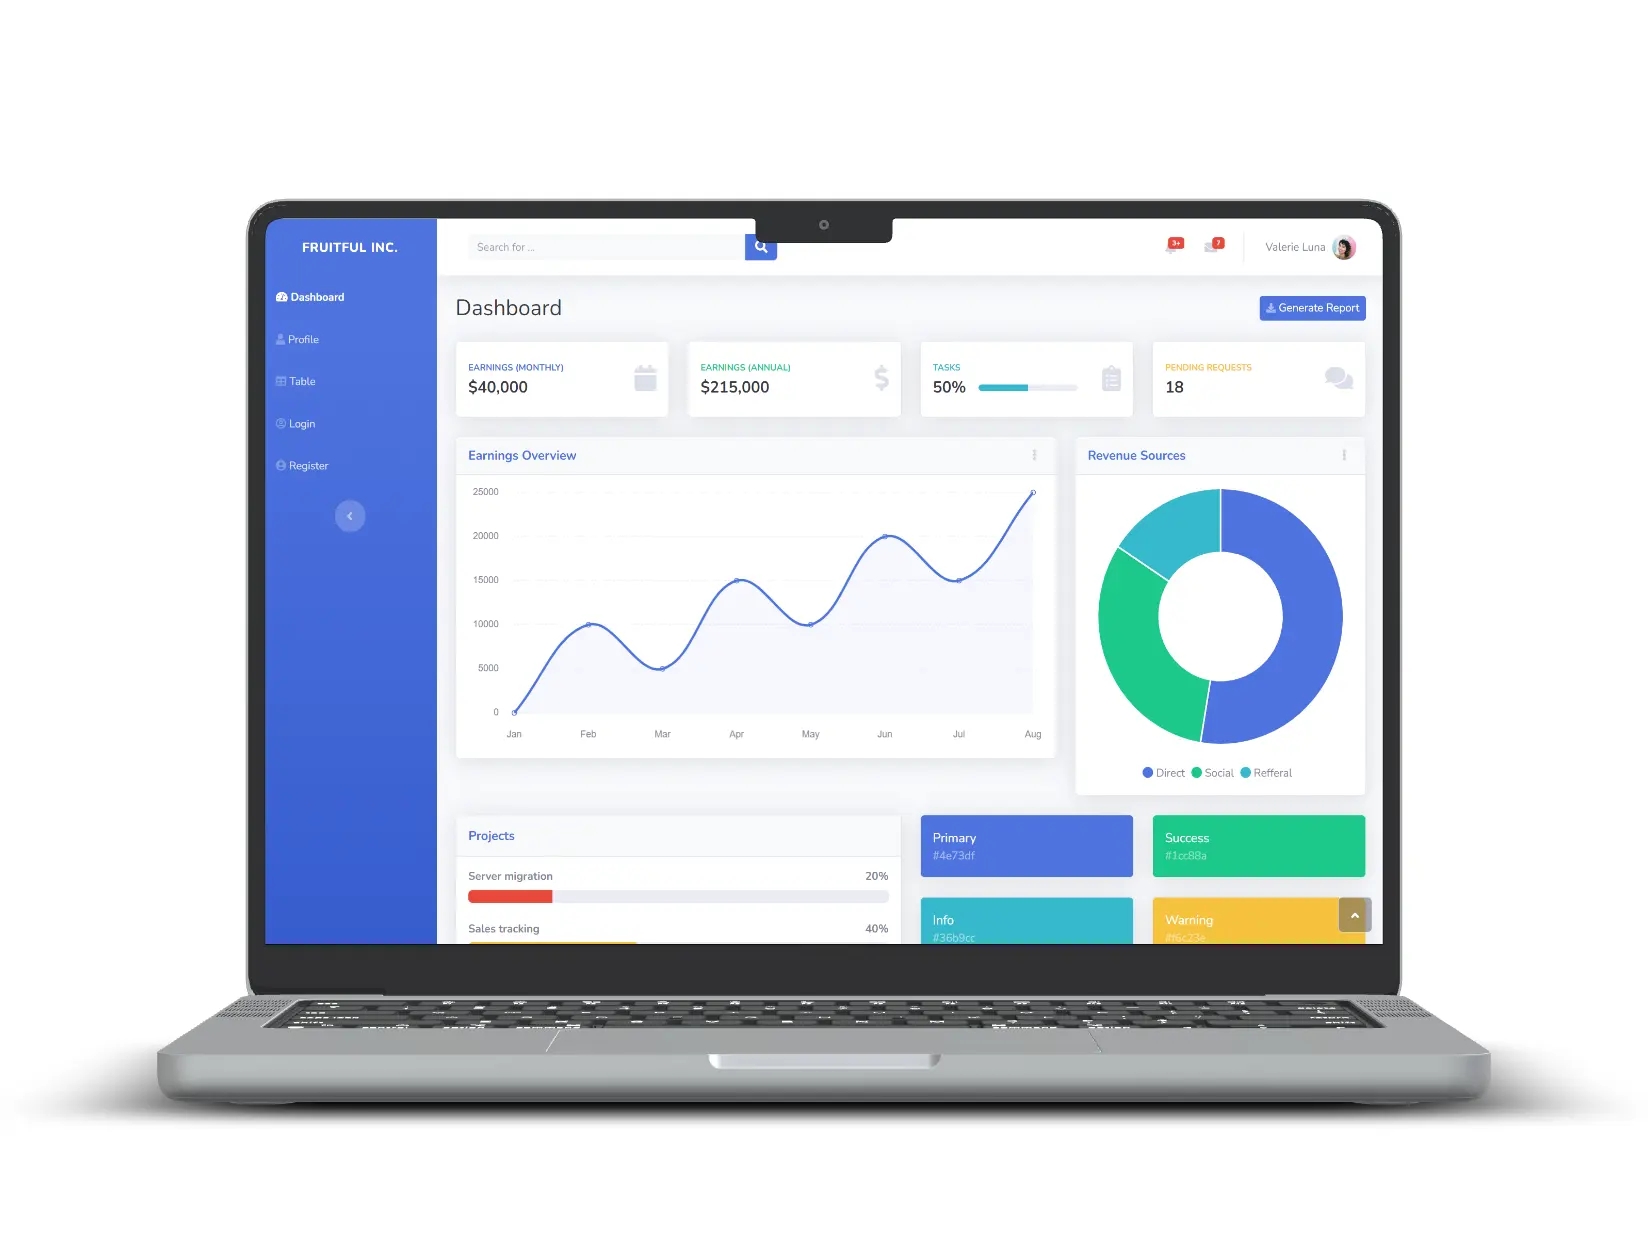
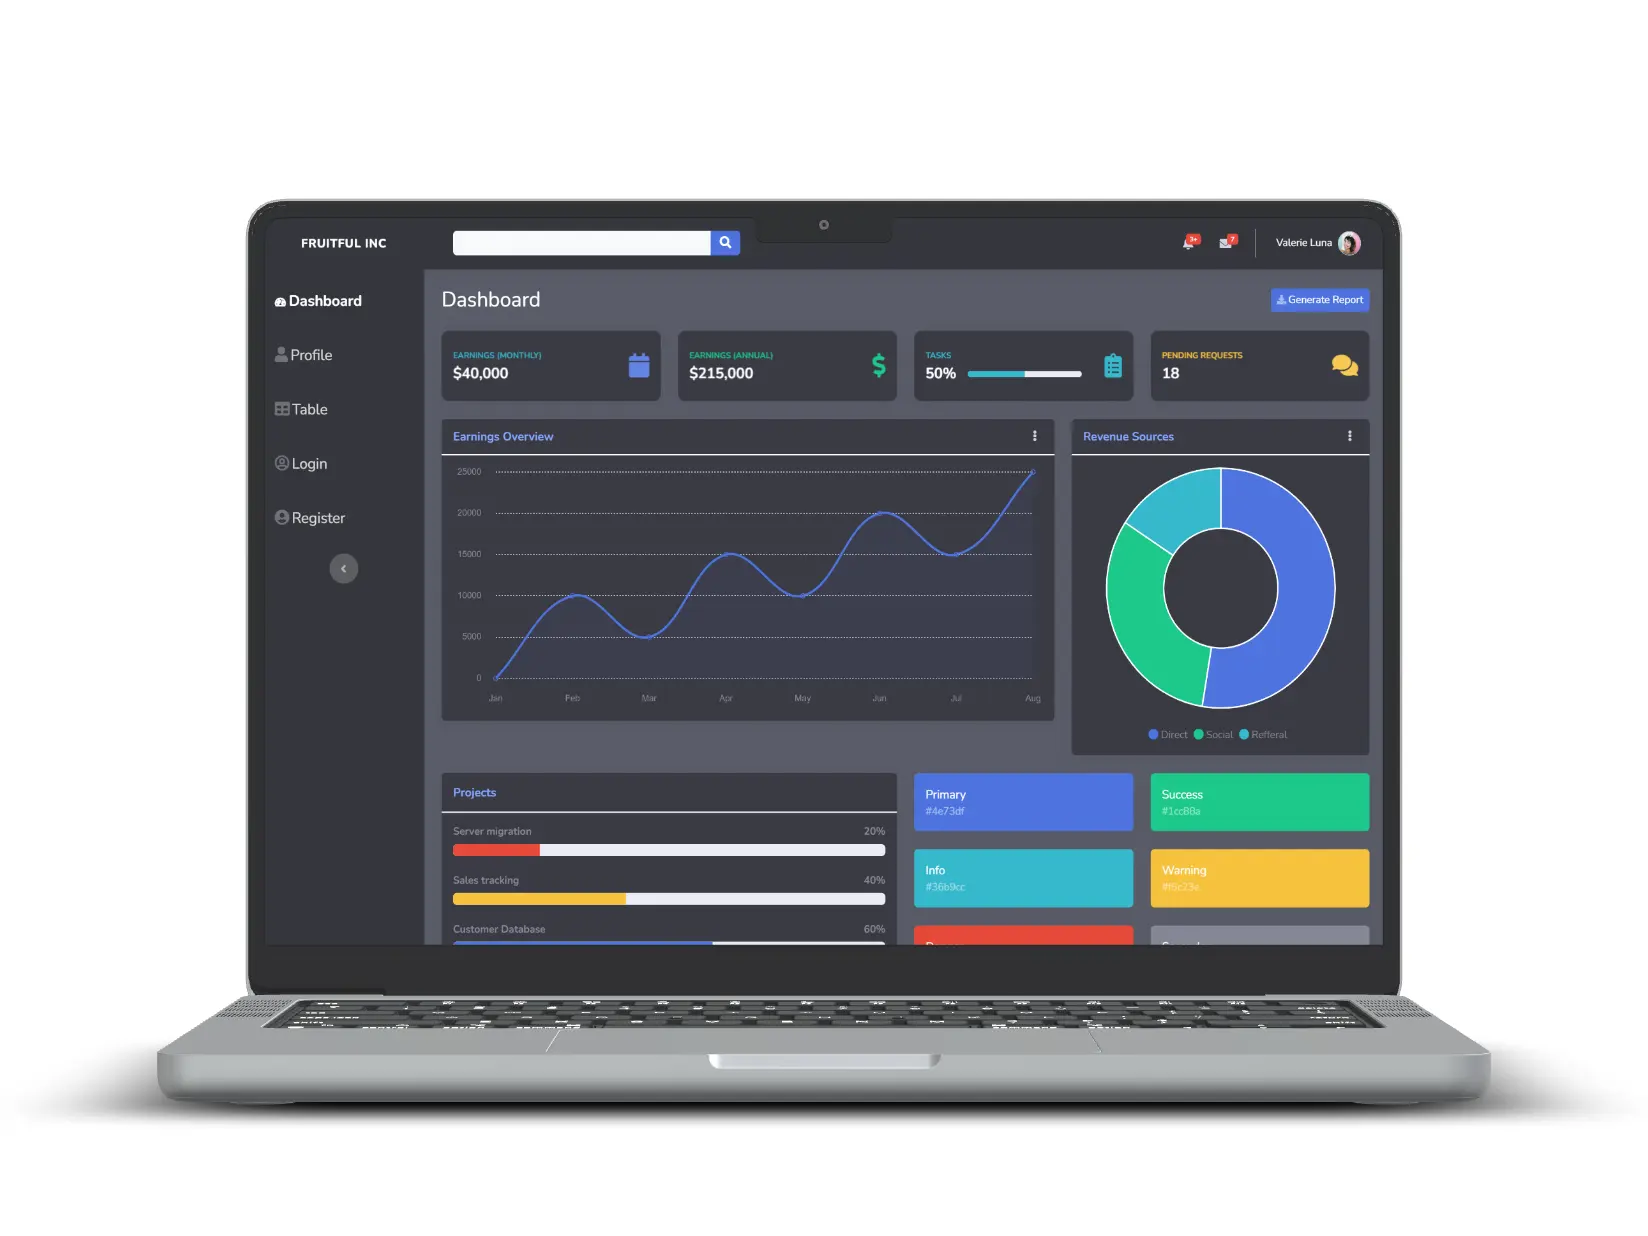
Fruitful Inc aimed to enhance user satisfaction by improving engagement with their dashboard interface. The challenge was to identify design improvements that would elevate the overall user experience.
To address this challenge, I conducted a comprehensive analysis of user journey data, focusing on key interaction points and pain areas within the existing dashboard. This involved leveraging both quantitative metrics and qualitative feedback to understand user behaviors, preferences, and pain points.
Key steps in the approach:
Examined user interactions within the dashboard, identifying areas of friction, drop-offs, and high engagement. This data provided insights into the user experience landscape.
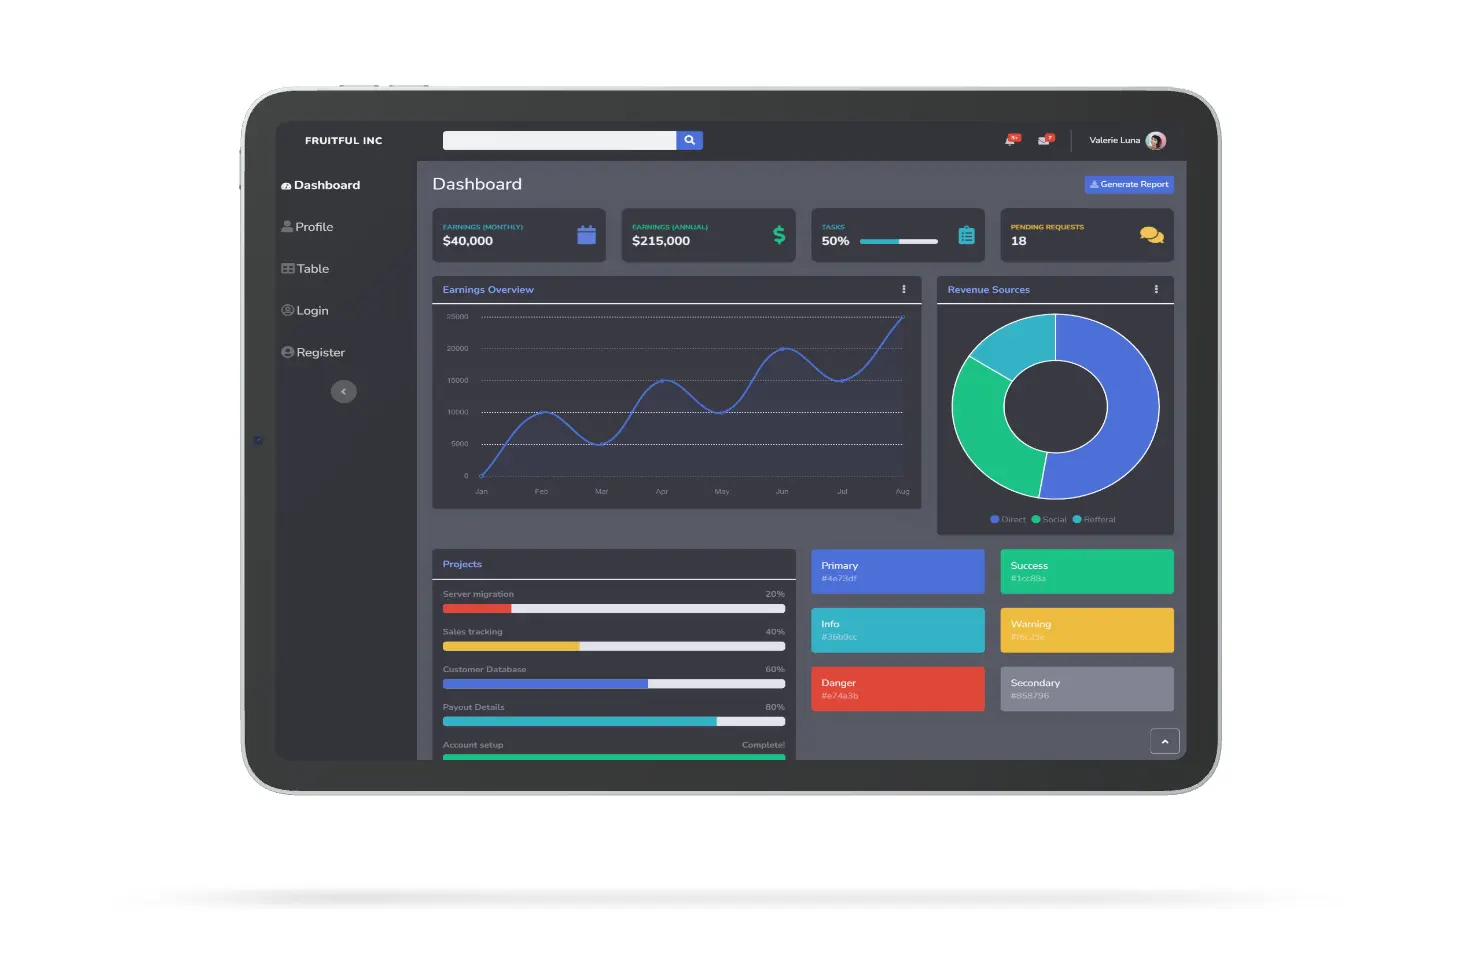
Integrated well-established interaction design principles to ensure a seamless and intuitive user experience. This involved optimizing workflows, reducing cognitive load, and enhancing user flow within the dashboard.
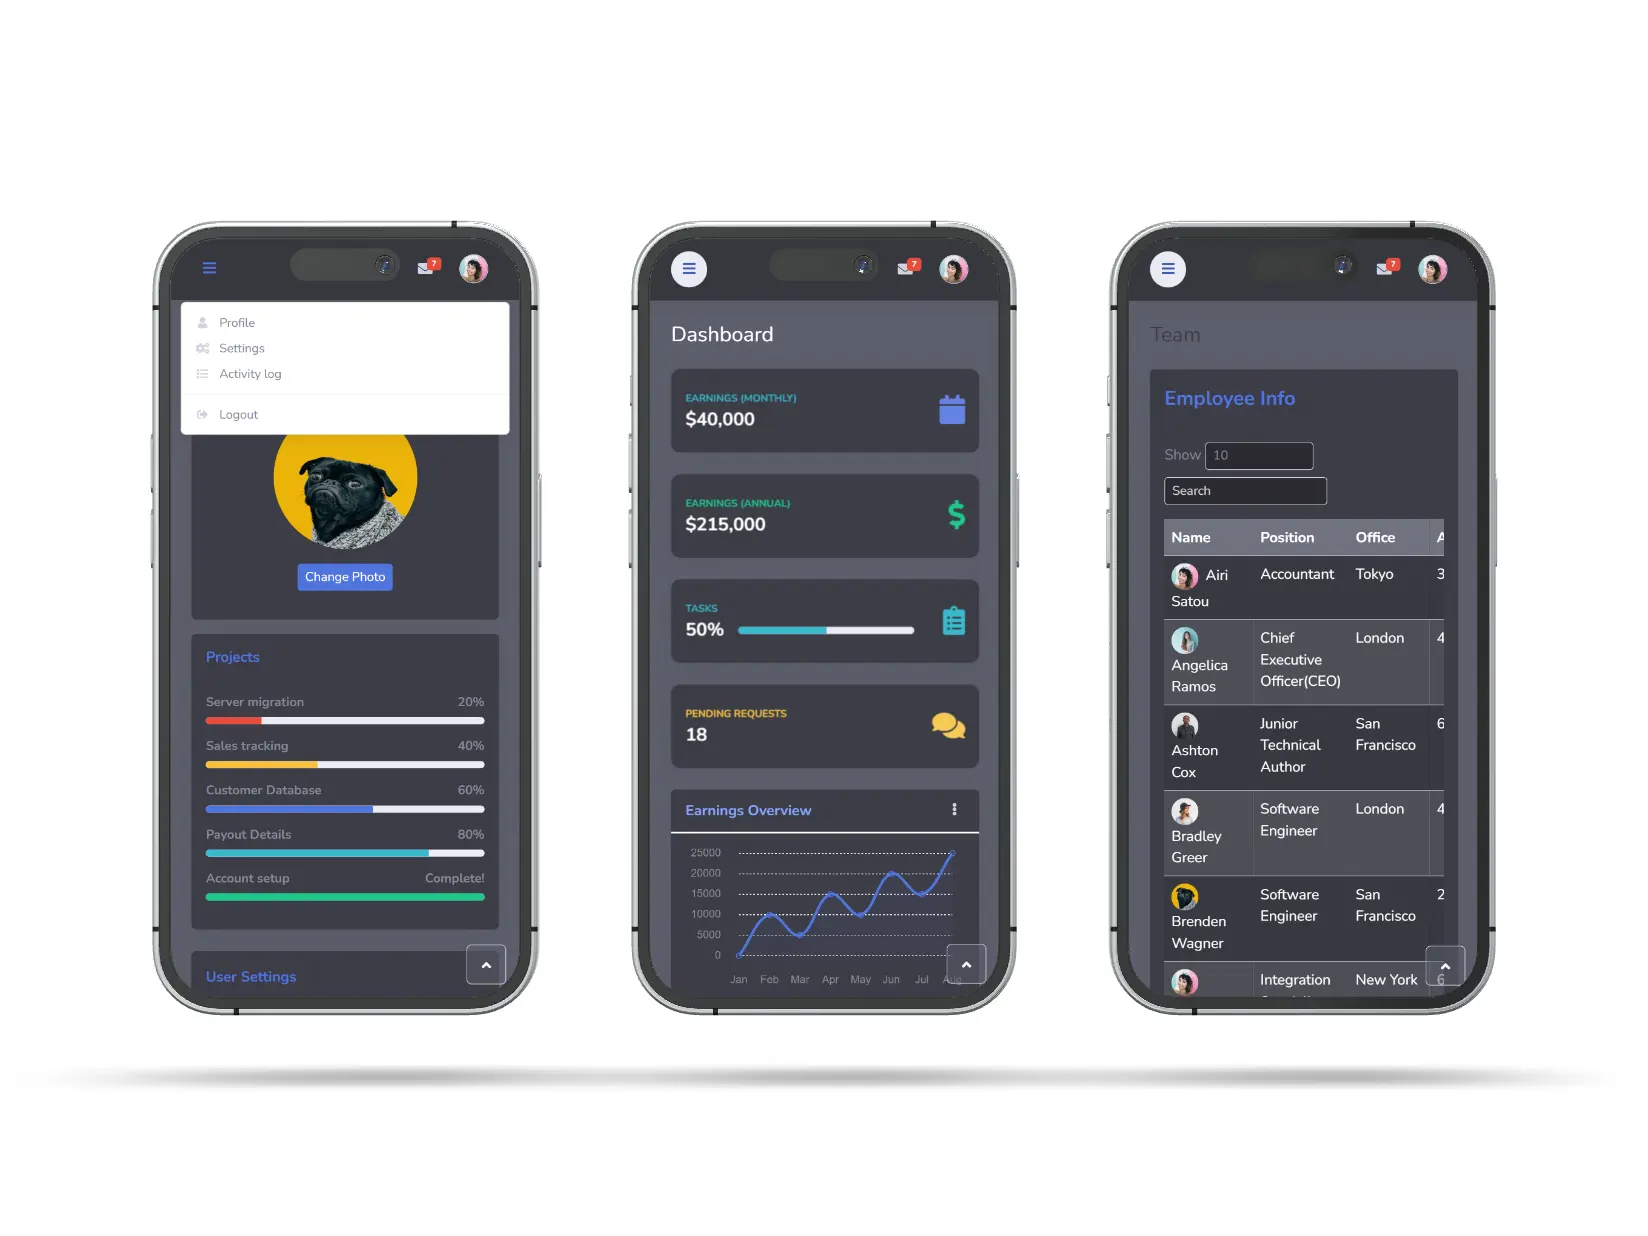
Implemented visual design principles to improve the aesthetic appeal of the dashboard. This included optimizing color schemes, typography, and overall layout to create a visually engaging and cohesive interface.
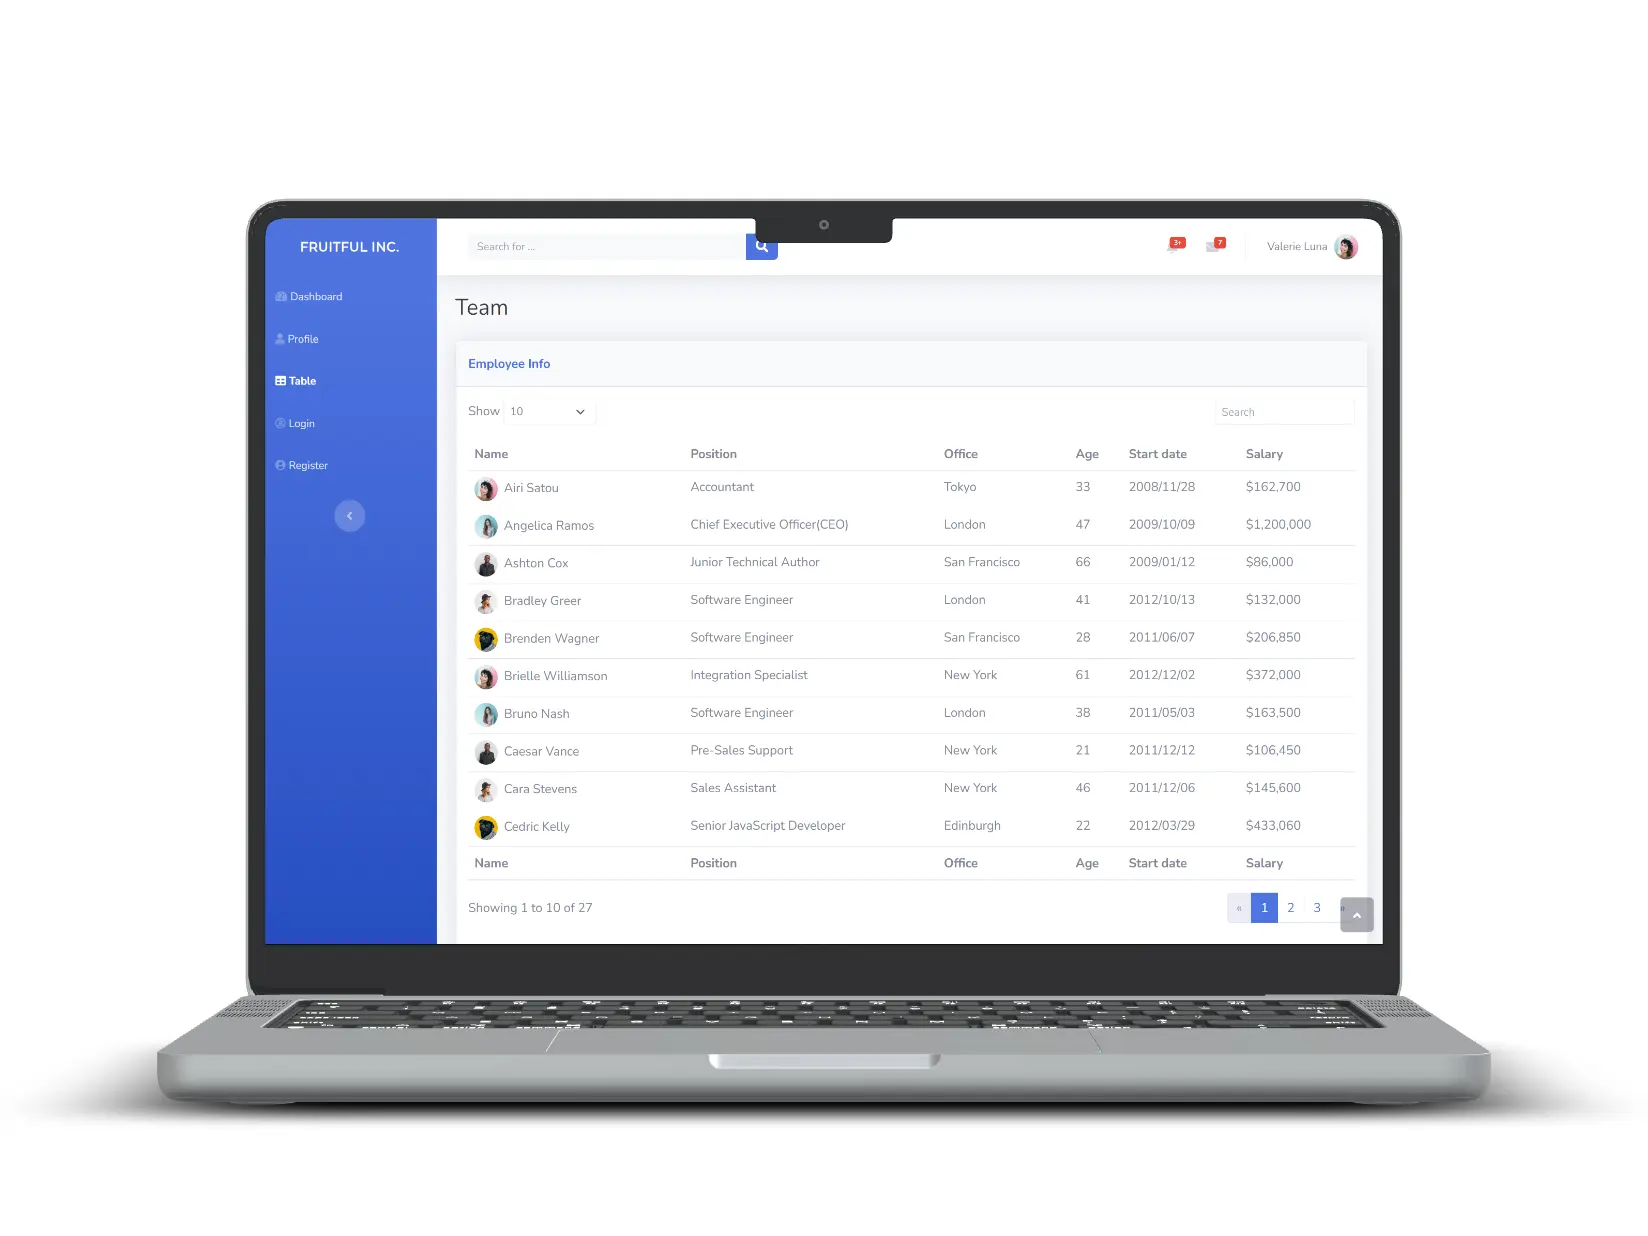
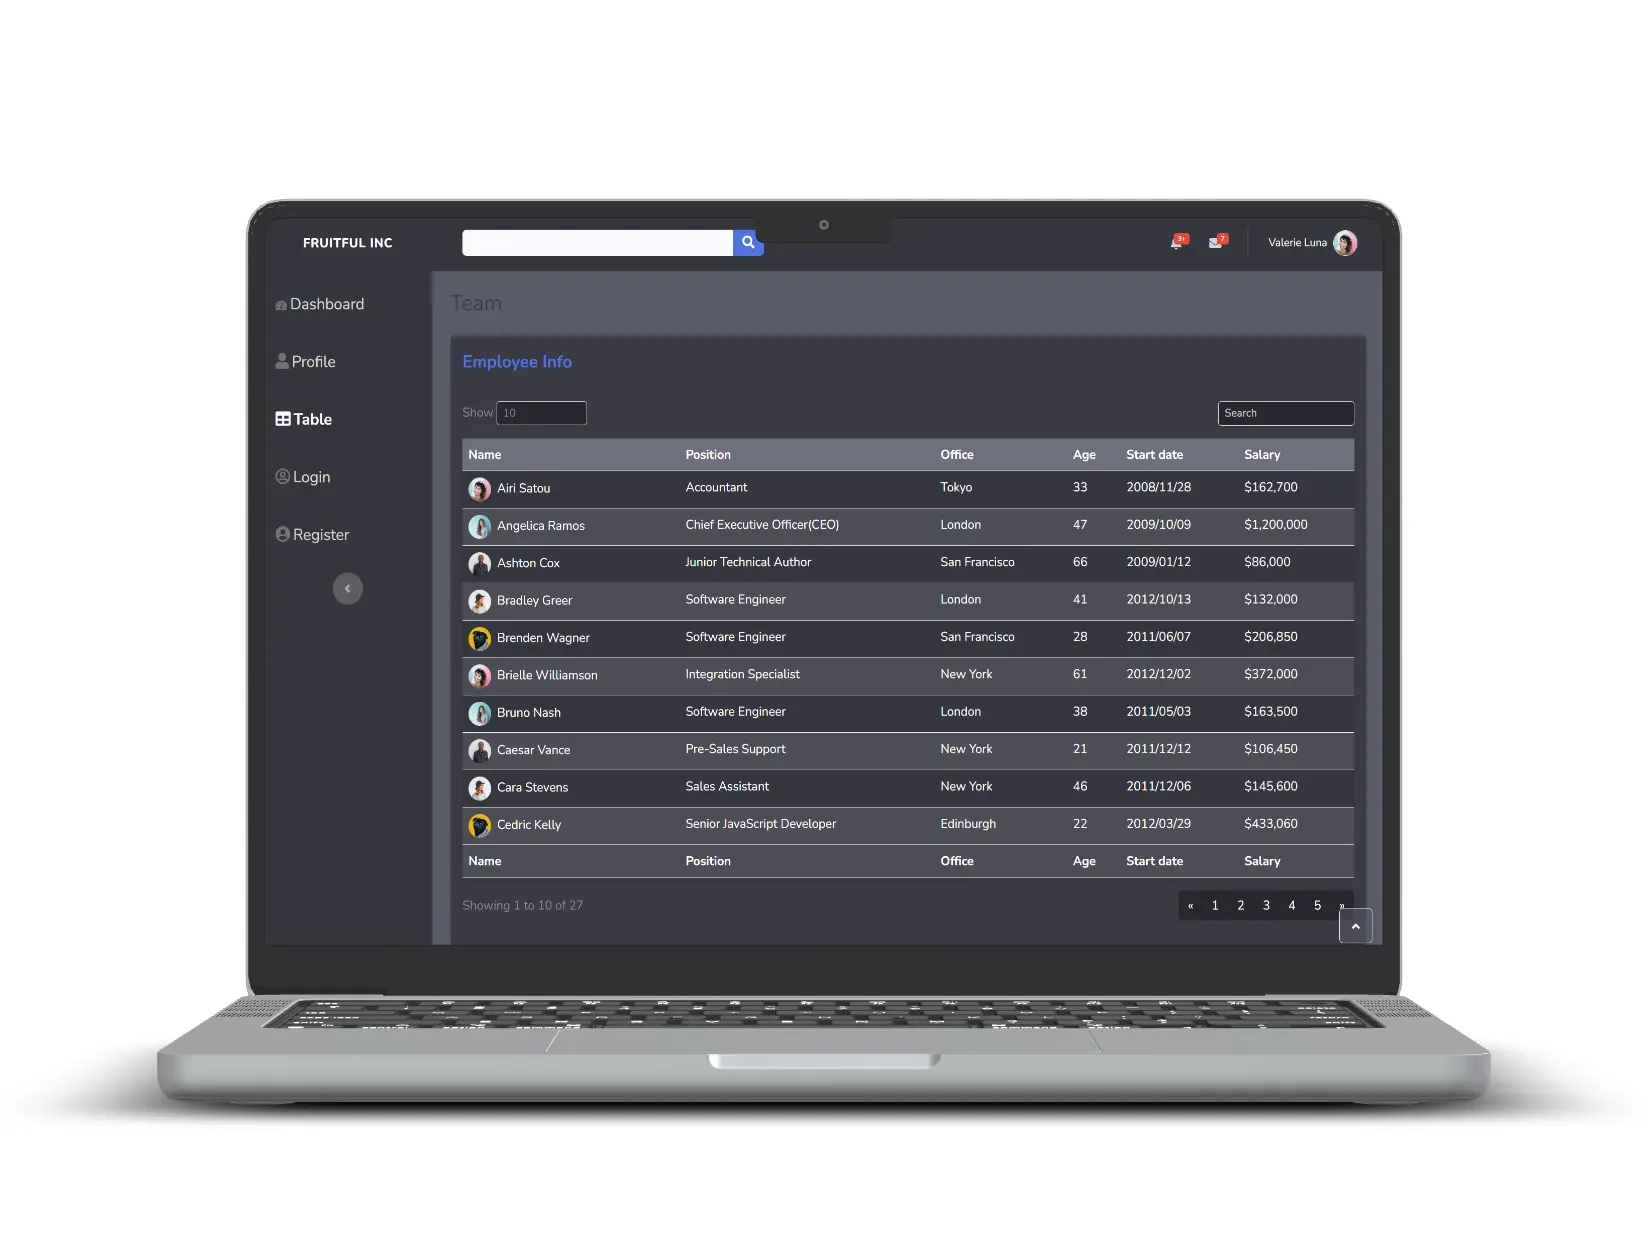
Restructured the layout and navigation to enhance overall usability. This included refining the information architecture and ensuring that key features were easily accessible to users.
The efforts to revamp the dashboard interface yielded significant and measurable results:
Applied design principles like visual hierarchy, progressive disclosure, and data visualization to streamline the financial SaaS dashboard, automating processes and reducing task completion time by 25%.
The enhanced design led to increased user engagement within the dashboard. Users were more inclined to explore features, leading to a positive impact on overall interaction metrics.
The improved dashboard contributed to a more positive perception of Fruitful Inc's platform among users. This positive sentiment can have a lasting effect on user loyalty and brand affinity.
In this phase, the strategic application of UX principles and data-driven insights resulted in a revamped dashboard that not only met the challenge of increasing user satisfaction but exceeded expectations. The 10% increase in user satisfaction, coupled with improved engagement metrics, showcases the effectiveness of a user-centric design approach. These positive outcomes align with the overarching goal of enhancing the overall user experience for Fruitful Inc's platform.

Objective: Achieve a 2.5x Increase in Website Traffic.
Key Metric: This KPI underscores our mission to significantly amplify Fruitful Inc's online presence through strategic UX decisions and user-centered design.
This KPI highlights our mission to boost Fruitful Inc's online presence with a 2.5x increase in website traffic, a testament to our strategic UX and user-centric design that attracts and engages a wider audience.
Objective: Attain a Stellar 25% reduction in task completion time with Visually Enhanced Dashboard Redesign.
Key Metric: This KPI highlights our dedication to creating a visually appealing dashboard that has become a hub of user satisfaction and informed decision-making.
This KPI showcases our dedication to an exceptional dashboard experience, with a 25% reduction in task completion time. Through visual enhancements, data-driven strategies, and user feedback, our dashboard has become a hub of satisfaction and valuable insights for informed decisions

Objective: Achieve a 17% Increase in User Retention Rates through User Behavior Analysis and A/B Testing
Key Metric: This KPI showcases our commitment to tailoring the platform to user preferences, resulting in significant improvements in user retention and engagement.
This KPI tackles our goal of nurturing enduring user relationships. Through user behavior analysis and A/B testing, we've achieved an impressive 17% rise in user retention rates. Our data-driven approach has personalized the platform, ensuring users consistently discover value and engagement within our ecosystem.
In these UX case studies, I highlighted how strategic UX decisions and data-driven approaches contributed to achieving specific objectives and enhancing the overall user experience for FruitfulInc's platform. In my role as a UI/UX Designer at FruitfulInc, my contributions have been instrumental in driving growth, improving the user experience, and streamlining operational efficiency. By harnessing data analysis, conducting A/B testing, forging close partnerships with developers, and executing usability testing, our collaborative efforts have yielded remarkable outcomes.
These achievements include a significant 2.5x increase in website traffic and an impressive 25% reduction in task completion time within the data-driven dashboard experience. These successes underscore Fruitful Inc's unwavering commitment to delivering exceptional user experiences while maximizing business opportunities for our valued clients
Through my work, we have successfully mitigated the risks associated with significant alterations, optimized our product development processes through Agile methodologies, and elevated dashboard engagement to boost user satisfaction. These accomplishments reflect our dedication to excellence in design and user experience, reinforcing FruitfulInc's position as a leader in facilitating fruitful connections and transactions within the business community.